|
Key Features |
|||
|
|
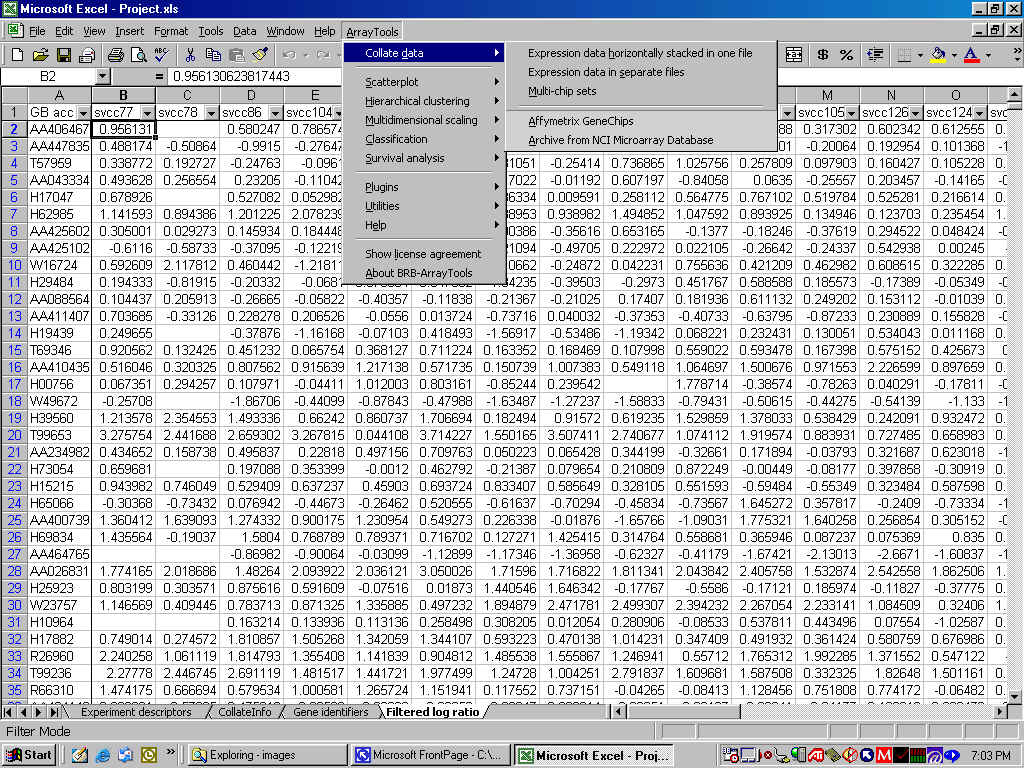
Excel Add-in Implemented as an Excel-Add-in, you can easily navigate the user friendly dialogues to carry out your analysis. You can also take advantage of the Excel environment to create your own custom graphs and data manipulations.
|
||
|
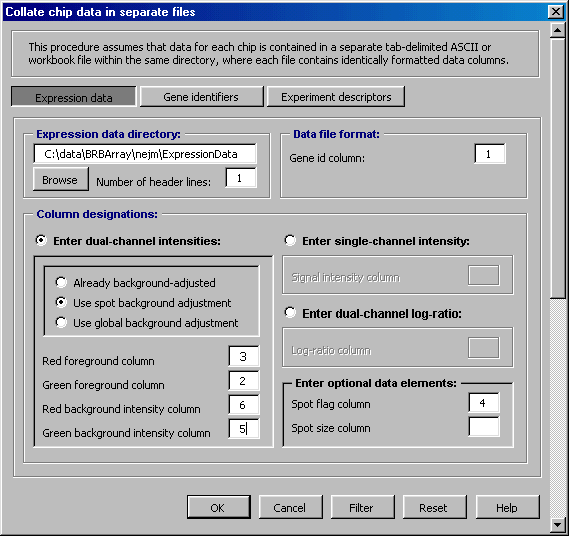
Flexible Data Import You can import a range of data formats, including arrays in separate files and arrays in a single horizontal file. Gene identification data can be included and merged with array data by identifying a Unique ID. The program can handle specification of flip-dye experiments, paired data, and technical replicates. For NIH users, the program provides an automated import of data from the mAdB database. For Affymetrix users, the program offers an automated import of common chip data, including multi-chip data.
|
|
||
|
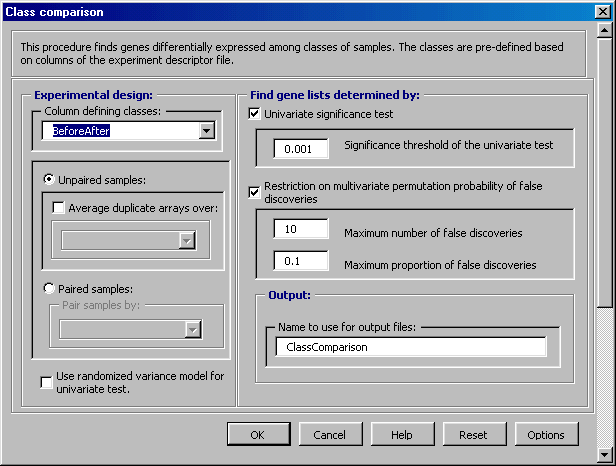
State-of-Art Statistical Methods Identify differentially expressed genes across groups (also referred to as "Class Comparison") using reliable statistical methods designed to better manage the false discovery rate. Construct and evaluate multivariate predictors for classifying unknown samples into groups based on gene expression profiles (also referred to as "Class Prediction").
|
||
|
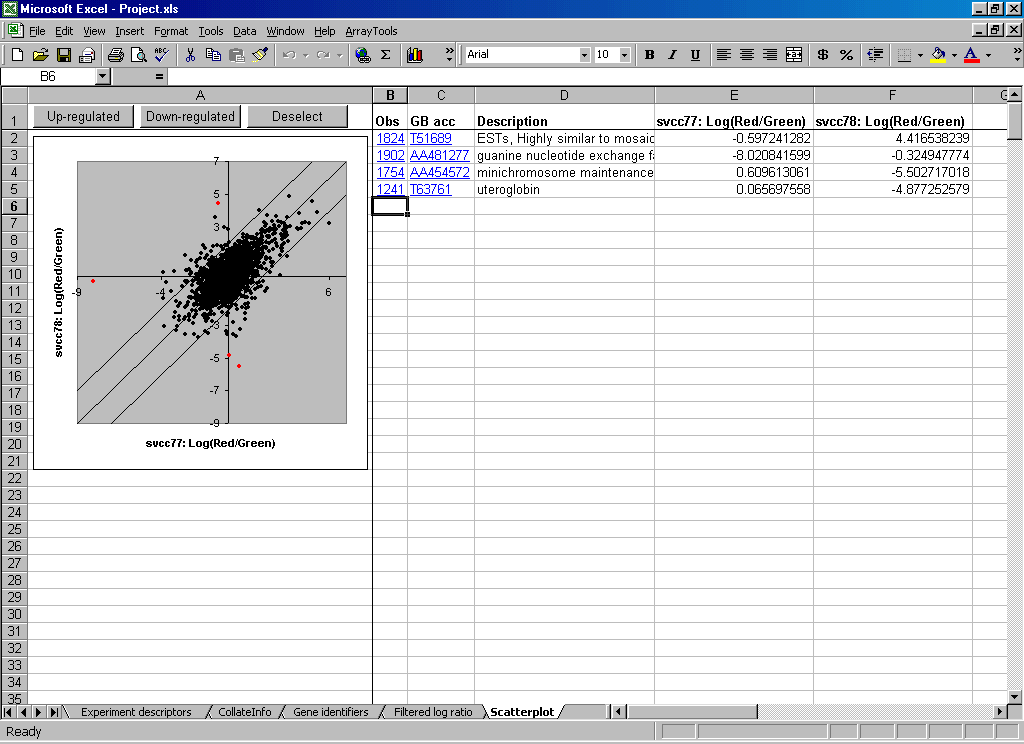
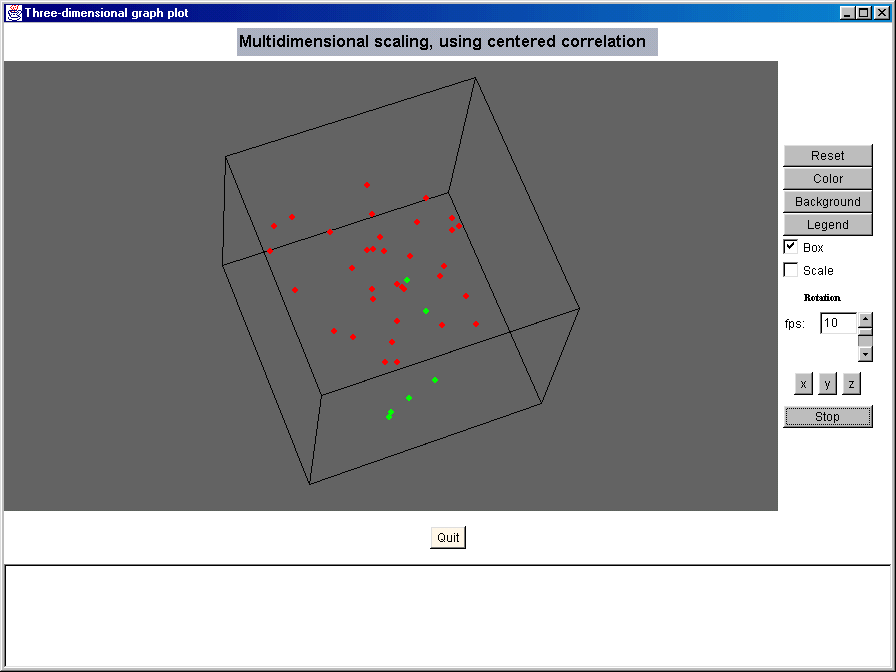
Sophisticated Visualization Tools Evaluate normalization methods and exclusion criteria using the generic Array vs Array scatter plots. Obtain preliminary evidence of differential gene expression using the Phenotype (or Class) scatter plot function. Evaluate dissimilarity of arrays using the Multi-Dimensional Scaling 3-D rotational plot function, the rotated 3-D plot can be included in a PowerPoint presentation.
|
 |
||
|
|
Integrate GeneLists with Bio Data You can selectively save interesting gene lists derived from hierarchal cluster analysis and any of the Class Comparison and Class Prediction methods as text files and as a formatted html report. You can access NCI feature reports and GenBank directly from the html report output. You can also import your own gene lists to facilitate your analysis. In addition, you can annotate your data by accessing the Stanford SOURCE database.
|
||
