Technical Notes
This page is still under construction, but some tips are now available. We hope to provide more detailed BRB ArrayTools user information on this page soon.
Please don't hesitate to contact us by email (Amy Lam) or using the BRB ArrayTools Message Board if you have questions.
How do I specify reverse fluor experiments?
Which normalization method should I use?
When should outlying expression levels be truncated?
Can I change the MDS array plot labels?
Data Import
- Affymetrix multi-chip data import
- Streamlined Affymetrix gene chip data import
Normalization
- Median of user-defined or Affymetrix HG-U95 or HG-U133 housekeeping genes
Filtering
- Exclude genes with no or minimal changes in expression using fold-change criteria
Multi-Dimensional Scaling
- Export the 3-D rotating plots to PowerPoint
Class Comparison
- Manage the number or proportion of false discoveries
- Use a randomized variance model for the univariate test
Class Prediction
- Diagonal linear discriminant analysis
- Use separate datasets for training and validation.
Survival Analysis
- Test for genes significantly associated with survival
R Plug-in
- You can enhance your analysis by adding your own R scripts without the need to write Visual Basic code
Documentation
- Expanded help conveniently accessed from the menu
- Tutorials and sample datasets
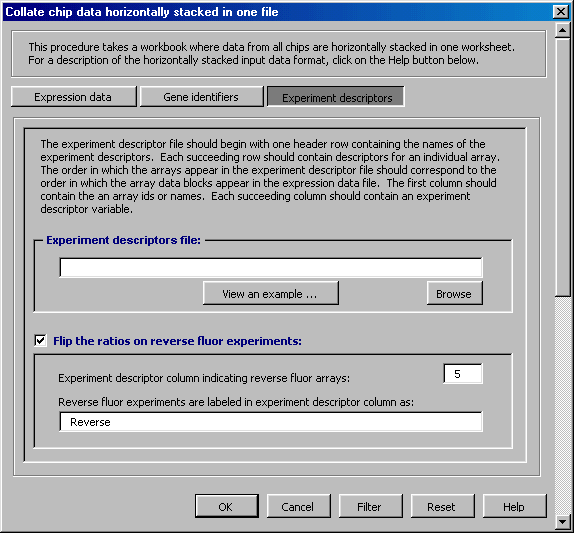
How do I specify reverse fluor experiments?
Identify reverse fluor arrays by adding a column in the Experimental Descriptor file with a value of Yes or No as shown in the example below.
| Exp_id | Red Probe | Green Probe | Short Desc | Reverse |
| HsOC0p4-1 0 Mins 16096 | 0 Mins | Control - 0 Mins | 0 Mins | No |
| HsOC0p4-2 15 Mins 16097 | 15 Mins | Control - 0 Mins | 15 Mins | No |
| HsOC0p4-3 30 Mins 16098 | 30 Mins | Control - 0 Mins | 30 Mins | No |
| HsOC0p4-4 60 Mins 16099 | 60 Mins | Control - 0 Mins | 60 Mins | No |
| HsOC0p4-5 3 Hrs 16100 | 3 Hrs | Control - 0 Mins | 3 Hrs | No |
| HsOC0p4-6 6 Hrs 16101 | 6 Hrs | Control - 0 Mins | 6 Hrs | No |
| HsOC0p4-7 9 Hrs 16102 | 9 Hrs | Control - 0 Mins | 9 Hrs | No |
| HsOC0p4-8 RF 9 Hrs 16103 | RF 9 Hrs | Control - 0 Mins | RF 9 Hrs | Yes |
| HsOC0p4-9 12 Hrs 16104 | 12 Hrs | Control - 0 Mins | 12 Hrs | No |
| HsOC0p4-10 15 Hrs 16105 | 15 Hrs | Control - 0 Mins | 15 Hrs | No |
Check the "Flip ratios on reverse fluors experiments" box on the data collation dialogue as shown below. Using the Experimental Descriptor file example above, the dialogue entries are 5 and Reverse.
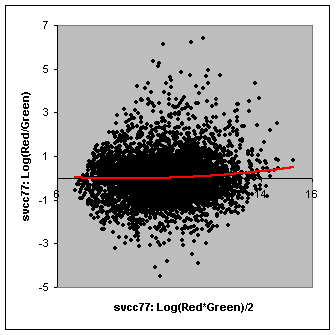
Which normalization method should I use?
The Array vs Array Scatterplot function can be used to evaluate normalization options. For example, if you have a two-color experiment, you can create M-A plots as shown below. An uneven distribution over the horizontal axis suggests a problem with bias that could be corrected using a different normalization method or a different approach to analysis.
When should outlying expression levels be truncated?
Extreme values can impact the integrity of the analysis. Histograms, box plots, and univariate descriptive statistics, all available in Excel or R, can be used to examine the data for possible outliers prior to analysis. Exclusion criteria will depend on the objectives of the experiment and the extent of potential interference from outliers. With BRB ArrayTools, analysis can be executed multiple times using different exclusion criteria followed by comparison of the results.
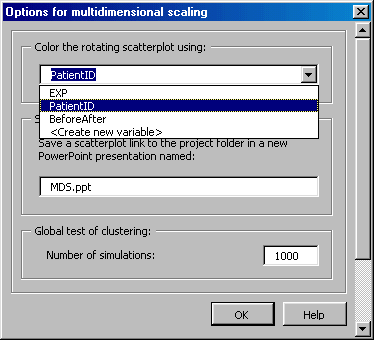
Can I change the MDS array plot labels?
You can change the MDS plot labels by selecting on the MDS dialogue Options button and selecting the appropriate variable from the drop-down menu as shown below.