Visualization Tools
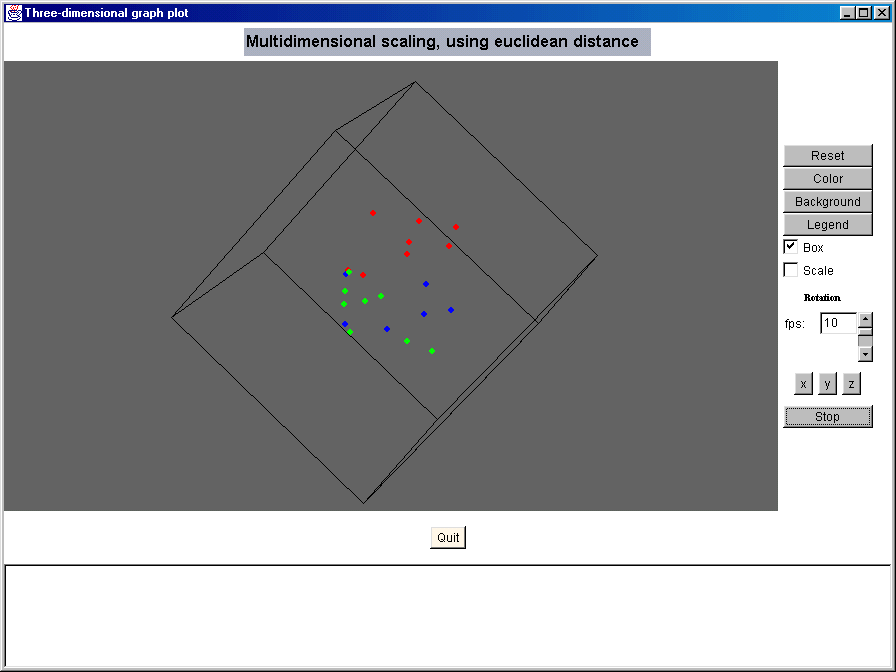
Multi-Dimensional Scaling
Reduce high dimensional data to graphical 3-dimensional, rotating displays using MDS.
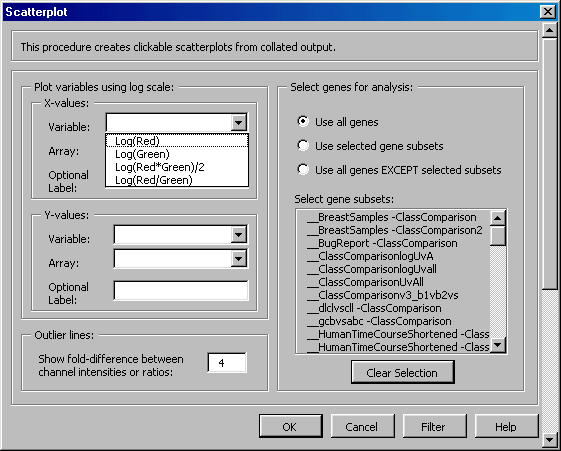
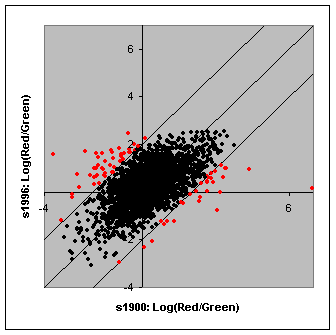
Use the Array vs Array Scatterplot Functionality to identify outliers, evaluate normalization options, identify experimental bias and systematic variations...
Fold Change Plots
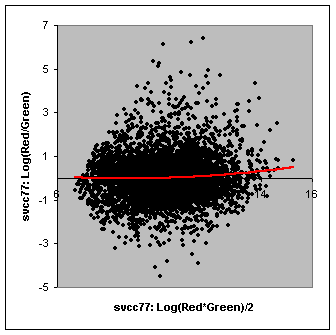
M-A Plots
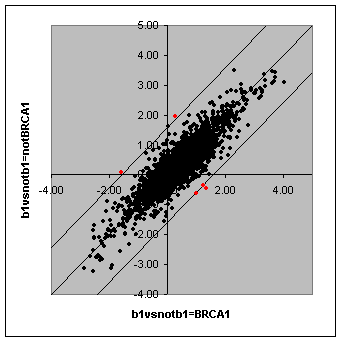
Generate quick scatterplots showing the average gene expression of one group vs another.
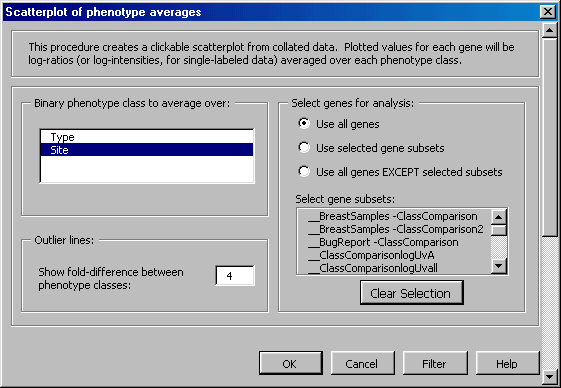
Identify outliers and genes with relatively large fold differences.
