


D3Oncoprint: a standalone software to visualize and dynamically explore annotated genomic mutation files
In order to support the interactive exploration of genomic datasets on local machines with no programming skills required, we developed D3Oncoprint, a standalone software to visualize and dynamically explore annotated genomic mutation files.
D3Oncoprint provides access to curated variants lists from CIViC, My Cancer Genome, and FDA approved drug indication listings to facilitate the use of genomic data for biomedical discovery and application. D3Oncoprint also includes curated gene lists to explore commonly investigated biological processes (i.e., BioCarta pathways, FoundationOne cancer panels).
Our software provides a flexible environment to dynamically explore the variant mutation profiles provided as input. The focus on interactive visualization with biological and medical annotation significantly lowers the barriers between complex genomic data biomedical investigators. We hope that this provides an important means of empowering researchers to translate the information from the collected data sets to biological insights and clinical applications.
IMPORTANT NOTE: Some operating systems may not allow by default the installation of "unofficial apps" downloaded from the internet. This issue is not specific to the D3Oncoprint executable file, but it depends on the OS security requirements. If the D3Oncoprint executable file doesn't seem to run, please inspect the operating system security warnings and allow the D3Oncoprint application to be downloaded and executed in your system. This issue should only occur once, as OS security settings are saved on your machine.
Documentation:
Publication:
- D3Oncoprint: Stand-Alone
Software to Visualize and Dynamically Explore
Annotated Genomic Mutation Files
Alida Palmisano, Yingdong Zhao and Richard Simon
JCO Clinical Cancer Informatics, 2018. nr. 2, p. 1-9
Screenshots:
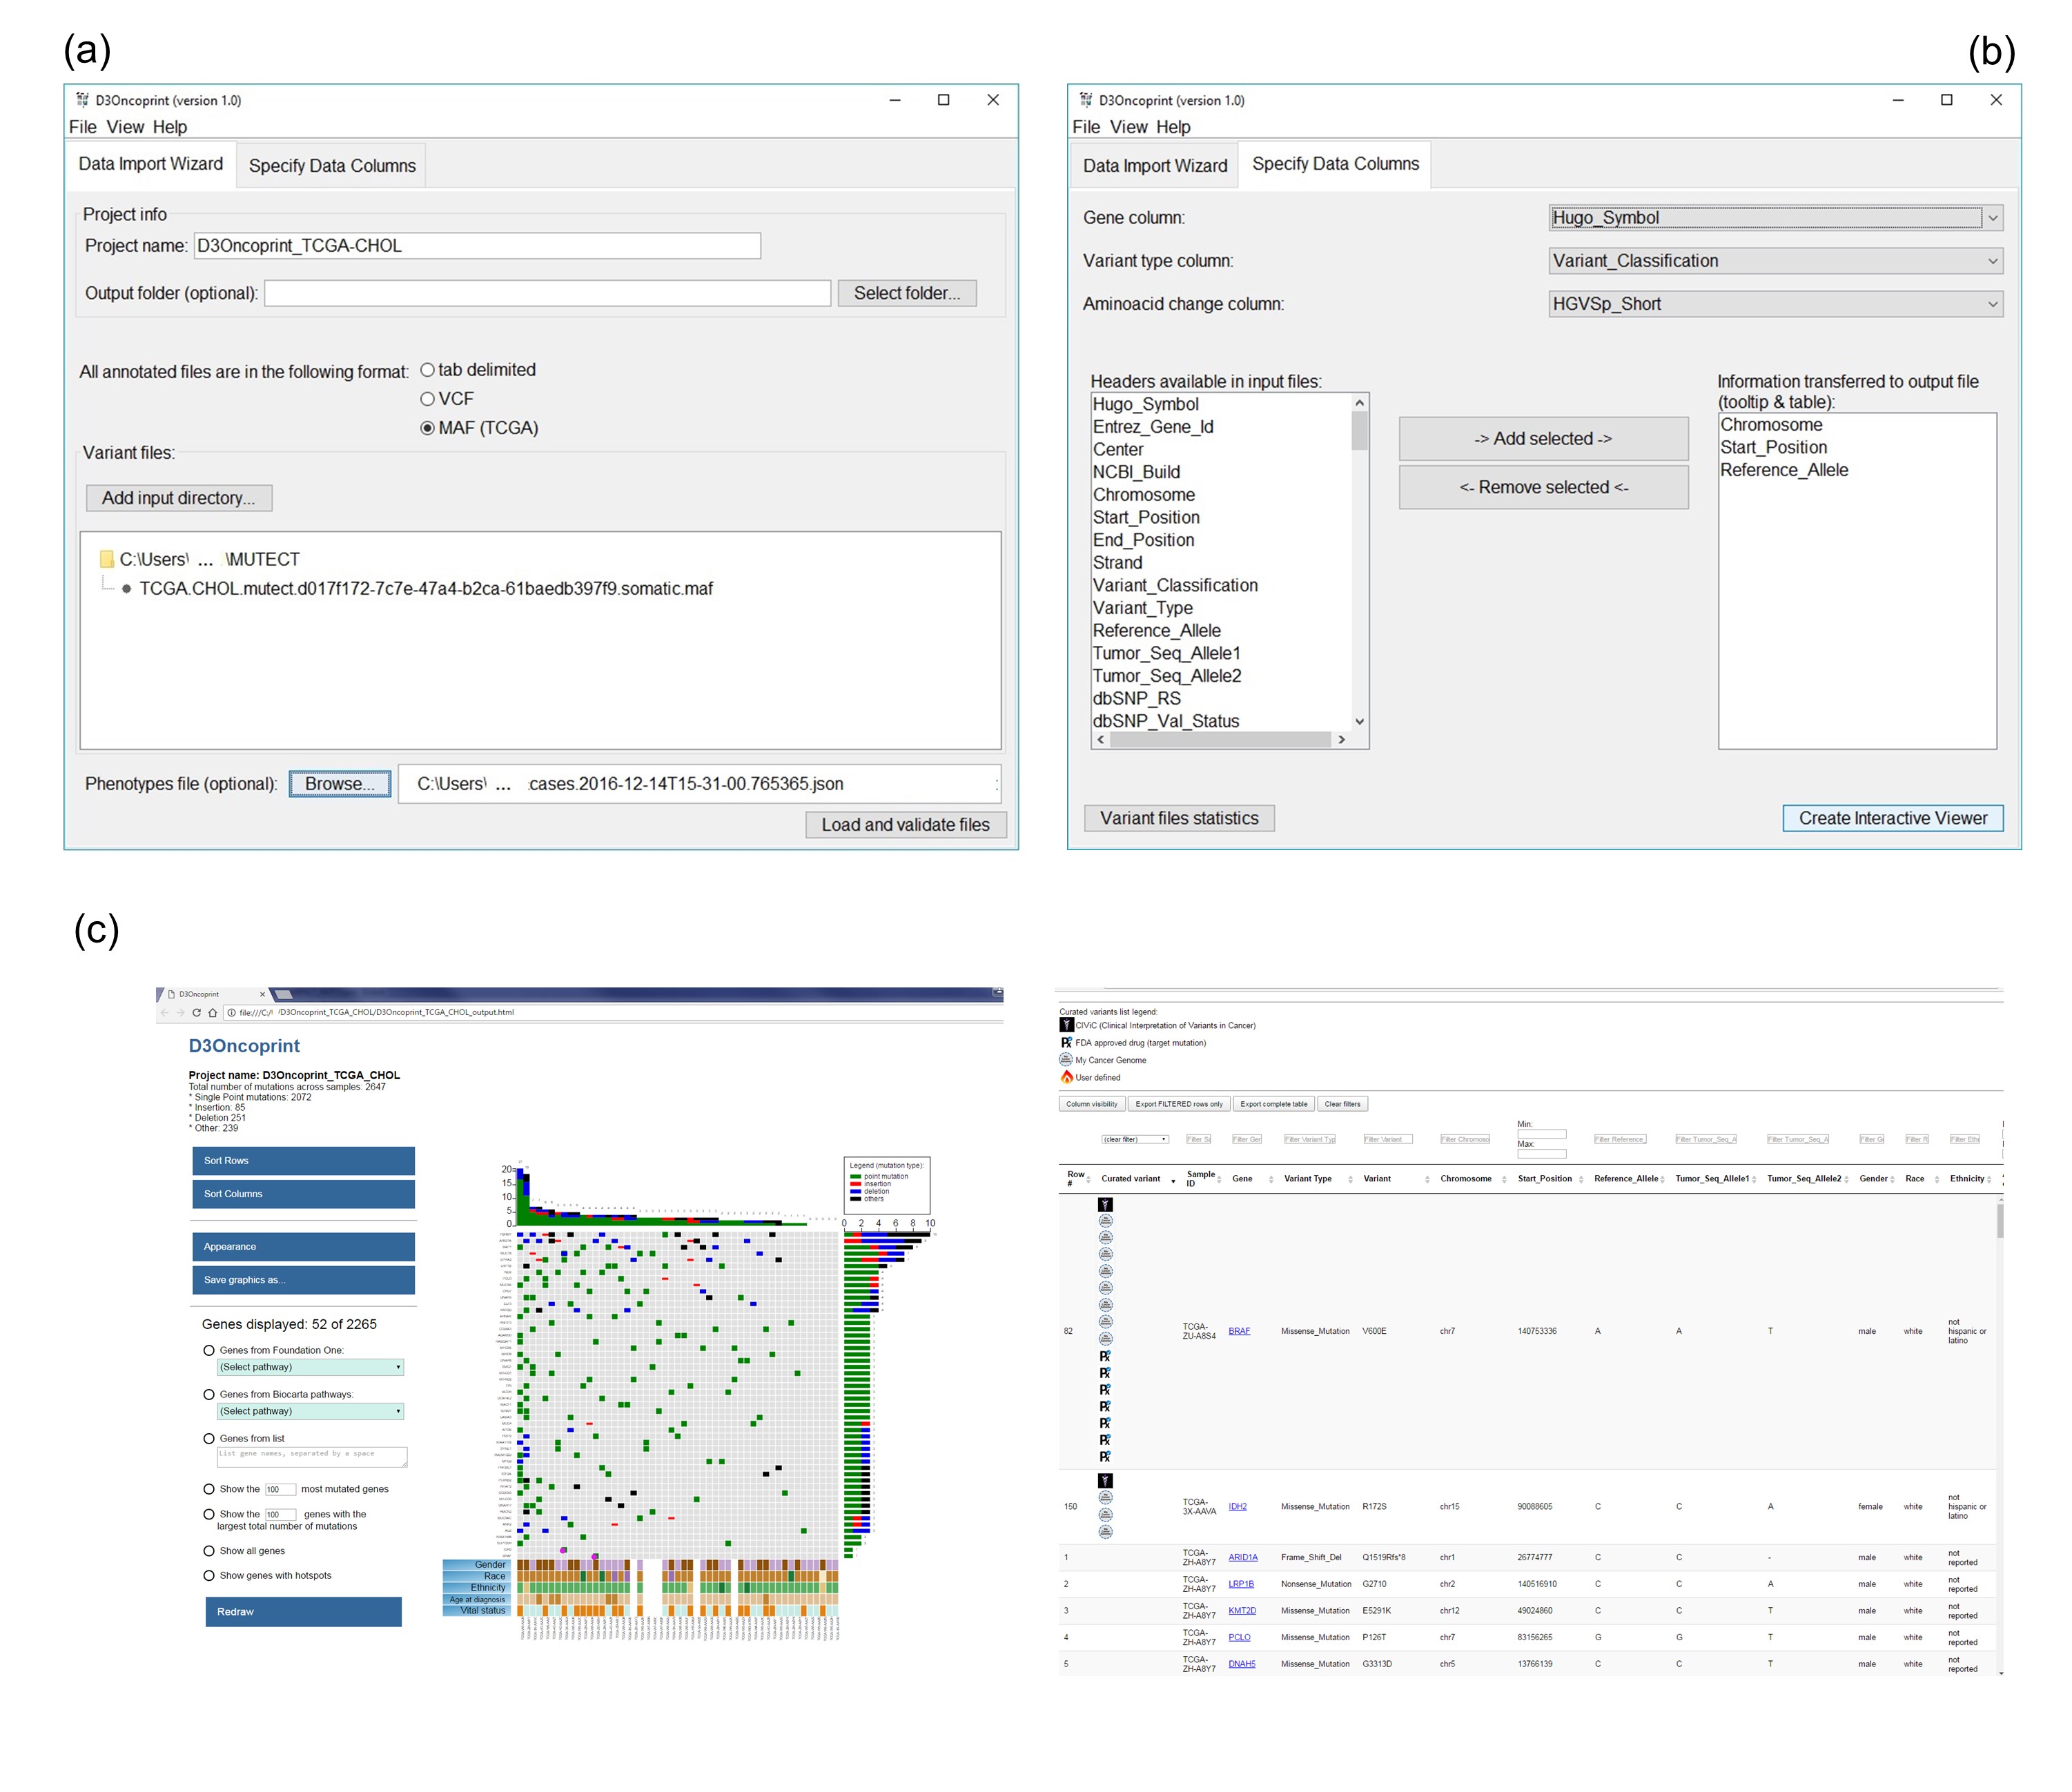
Figure 1: (a) Data Input tab, used by the user to give the project a name and select the input files from the files system. (b) Selection of the data columns to match the content of the input files to the fields required by D3Oncoprint to generate the interactive plots. (c) An example of a generated HTML page: an interactive heatmap, exploration buttons and a dynamic datatable displaying all variants across the input samples. More details about D3Oncoprint interface are available in the User Manual .
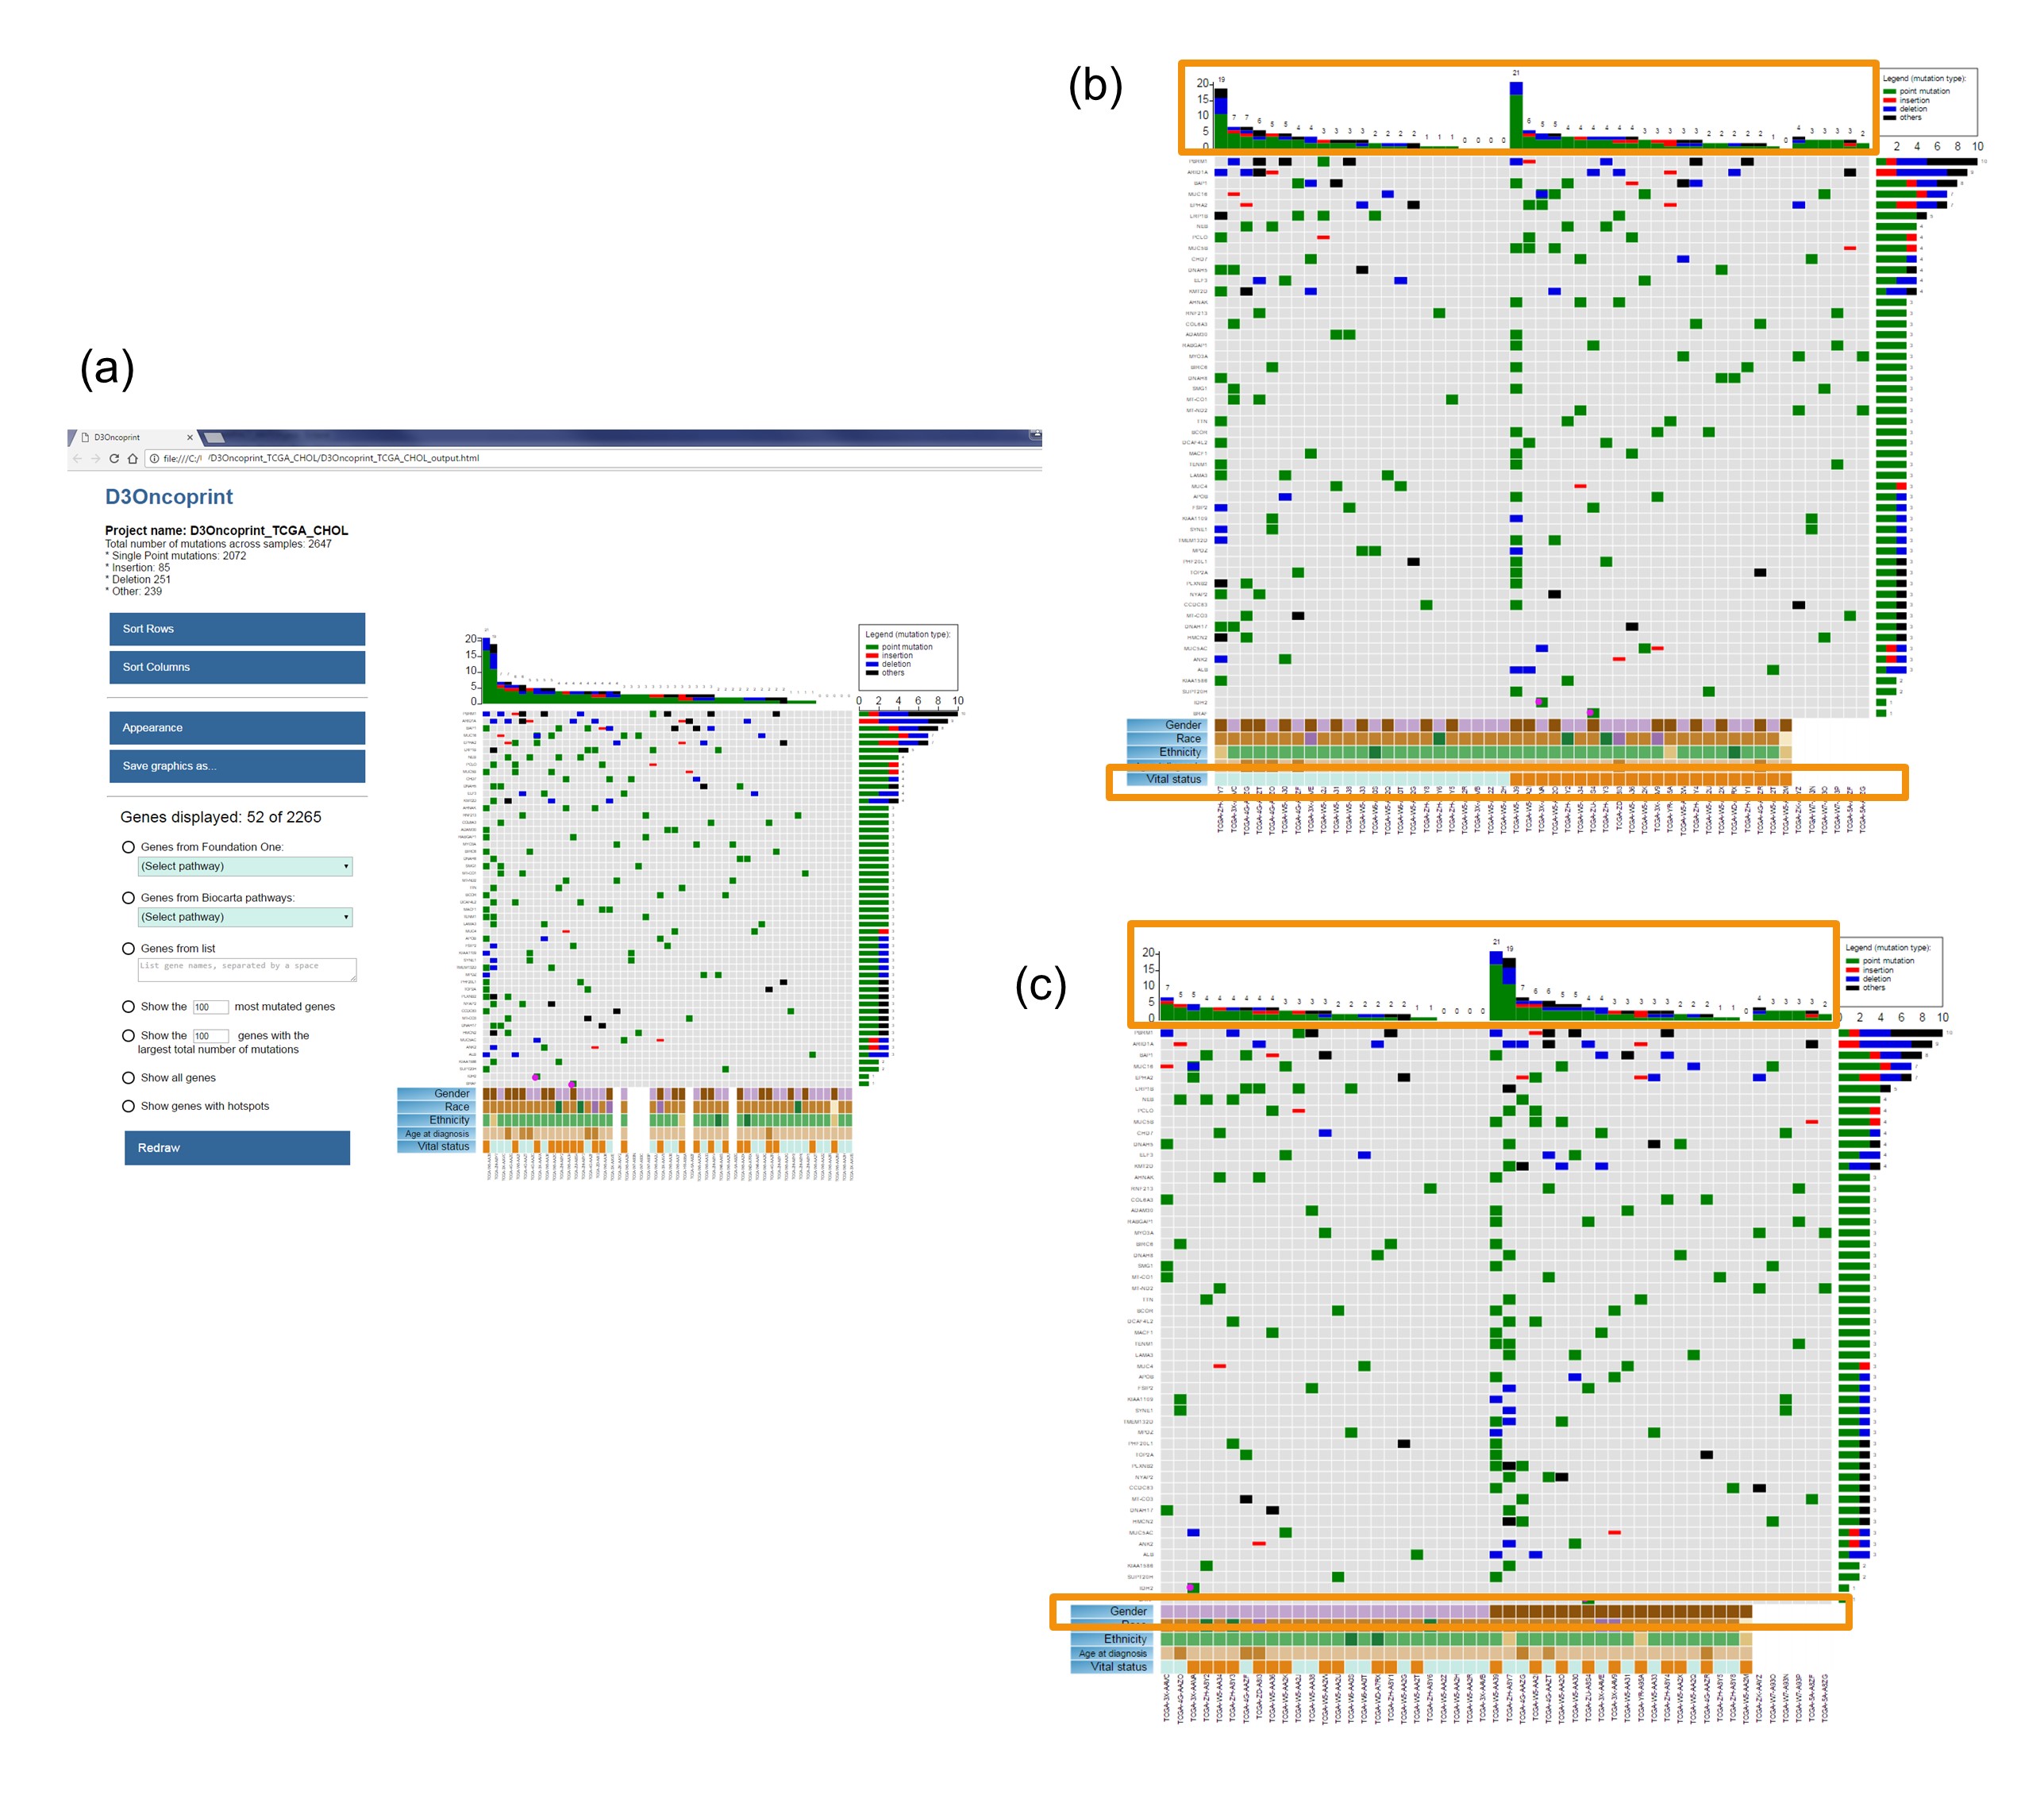
Figure 2: D3Oncoprint heatmaps for the TCGA-CHOL cohort. Rows represent genes, and columns represent samples. The default view (a) sorts the genes by total mutation count across all the samples, and it sorts the samples by total mutation count across all the genes. Different types of mutations are identified by different colors in the grey heatmap (point mutations, insertion, deletions, etc). Moving the cursor on a cell with mutation will display a popup with some information about that mutation. Rows can be dragged up/down by clicking and moving the gene name label. Columns can be dragged left/right by clicking and moving the sample name label. Phenotypes are listed in the lower part of the heatmap, and phenotypes' labels act like sorting buttons: clicking any of these button will move around the columns separating the samples according to the clicked phenotype value (Vital status (b) and Gender (c)). More details about the interpretation of the different maps are included in the User Manual.
Disclaimer: This resource is intended for purely research purposes. It should not be used for emergencies or medical or professional advice.