


TPWshiny: an interactive RShiny app to explore the therapeutic response of NCI-60 cell lines
TPWshiny is a powerful standalone visualization tool for the genome-wide characterization of NCI-60 human cell lines and response to 15 different anticancer drugs at different time points. The underlining data comes from the ''NCI Transcriptional Pharmacodynamics Workbench'' (NCI TPW), an extensive compilation of directly measured transcriptional responses to anticancer agents. The NCI TPW data is publicly available through a web interface that allows limited user interaction with the data (https://tpwb.nci.nih.gov/).
We developed "TPWshiny" as a standalone, easy to install, R Shiny application to facilitate more interactive data exploration. This package provides an intuitive interface to facilitate better understanding of tumor cell characteristics of nine different tissue types and help researchers further their investigations in this field. The data is presented in interactive scatter plots, heat maps, time series and venn diagrams. All information can be queried by drug concentration, time point, gene and tissue type. Researchers can download the data for further analysis.
Software License: Please read the full terms of the license here.
For technical issues, please contact the Support Team at ncitpwsupport@mail.nih.gov.
Options to run TPWshiny:
- TPWshiny.R source code version 1.1 (that can be launched directly within an R console or RStudio)
- download the R code TPWshiny.R (107 KB) (requires R 4.3 or above);
- install the 'groundhog' package, used by the source code to automatically download any missing R package TPWshiny requires;
- to launch: set the working directory as the directory where you saved TPWshiny.R (using the command "setwd") and run the app with the command shiny::runApp('TPWshiny.R');
- alternatively, in RStudio, you can simply click the "> Run App" button located at the top right corner of the RStudio interface.
- TPWshiny has been deployed on a shinyapp server.
You can access it directly at https://ncibrp.shinyapps.io/TPWshiny1/ - WINDOWS operating system (includes R portable)
- download the standalone TPWshiny for Windows (170 MB);
- run the self-extracting exe file to create a "TPWshiny" directory (about 500 MB);
- from the extracted TPWshiny folder, run the "TPWshiny.bat" file to start the application.
- MAC operating system: the standalone TPWshiny is not compatible with the current OS architecture. Users who want to run the application locally can download the source code and run it in R (instructions above); alternatively, the server version of TPWshiny is available for easy and quick exploration of the TPW dataset at https://ncibrp.shinyapps.io/TPWshiny1/
- TPWshiny: an interactive R/Shiny app to explore cell line transcriptional responses to
anti-cancer drugs
Peter Zhang, Alida Palmisano, Ravindra Kumar, Ming-Chung Li, James H. Doroshow, Yingdong Zhao
Bioinformatics, Oxford Academic https://doi.org/10.1093/bioinformatics/btab619 - The main interface of TPWshiny shows the available tabs at the top, selection options on the left and the main plot in the center. Shown, LIF expression following 24 hours of exposure to high-concentration doxorubicin.
- Scatter plot of MYBL1 expression for a selection of cell lines (CNS, Melanoma, Prostate and Renal).
- Heatmap of genes in the cell cycle pathway and the effect of vorinostat on their expression level. The cell lines (x-axis) and the target genes (y-axis) are both clustered.
- Time plots showing RRM2 gene expression changes over the 3 available time points across 9 tissue types for the high dose of geldanamycin and cisplatin.
- Distribution of the 100 genes with the largest absolute correlation between changes in gene expression and GI50 of cisplatin, doxorubicin, gemcitabine, and topotecan treated with a low concentration for 24 h. The genes are displayed in a Venn Diagram and Upset plot, to identify genes of common sensitivity/resistance. The list of gene names in each group is displayed below the graphs in TPWshiny.
Click here for execution instructions...
Click here for Windows instructions...
IMPORTANT NOTE: Some operating systems may not allow by default the installation of "unofficial apps" downloaded from the internet. This issue is not specific to the TPWshiny executable file, but it depends on the OS security requirements. If the TPWshiny executable file doesn't seem to run, please inspect the operating system security warnings and allow the TPWshiny application to be downloaded and executed in your system. This issue should only occur once, as OS security settings are saved on your machine.
Documentation:
Publication:
Snapshot of TPWshiny in action:
For additional information please refer to the Publication and the Documentation/User
Manual.
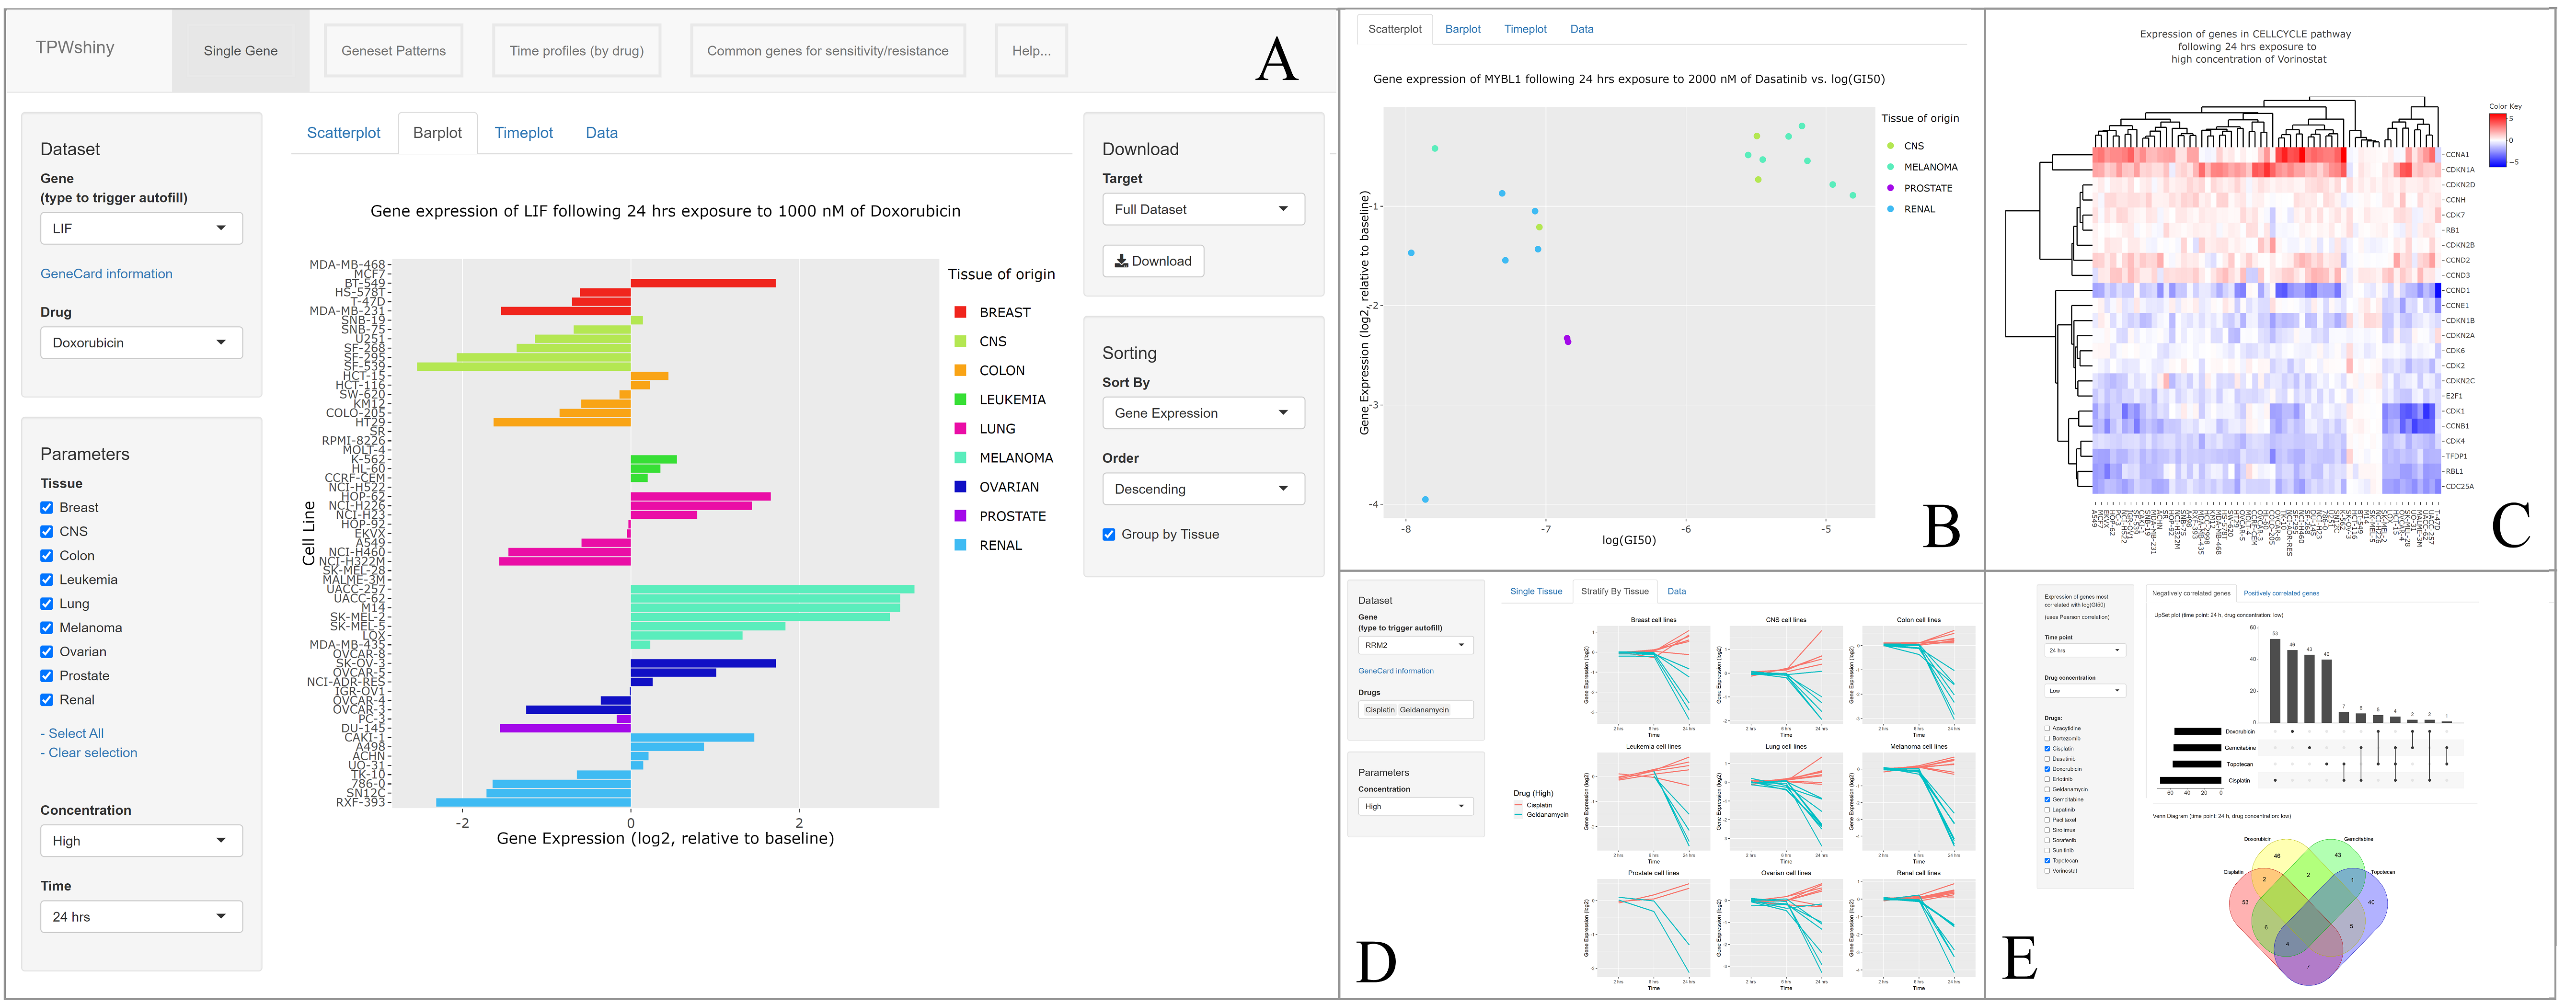
In the figure:
Disclaimer: This resource is intended for purely research purposes. It should not be used for emergencies or medical or professional advice.